Analytics (Insights)
ARK has a default analytics report, called Students At Risk
This is the multi-page printable view of this section. Click here to print.
ARK has a default analytics report, called Students At Risk
The Students At Risk report is a default analytics (Insights) model.
It is a computer model that analyses student behaviour in the unit in order to identify students at risk of not completing the unit.
In addition to how recently the student accessed the unit, the model uses indicators such as, accessing resources, participating in forums and working through lessons to score student engagement with the materials. Students who appear to be engaging significantly less may then be flagged as falling behind. This report can assist staff in quickly identify students who might not be keeping up with their peers.
The analysis is run frequently and is set up to examine data across a two week window in making determinations. It will notify those with a teaching role in the unit if there are any students that the model deems to be at risk.
You can choose whether you receive an notification from ARK if the insight identifies students.
Go to the User menu (in the top right) > Preferences > Notification preferences.
Locate the line Insights generated by prediction models.
Select your notification preferences.
You can view Insights when you wish by navigating to the tabs menu (under the Unit title) > Reports > Insights
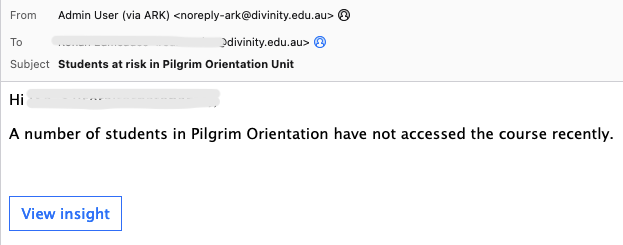
The notification email informs the recipient that one or more students in the unit are considered at risk and links to the ‘insight’ for further information and actioning.

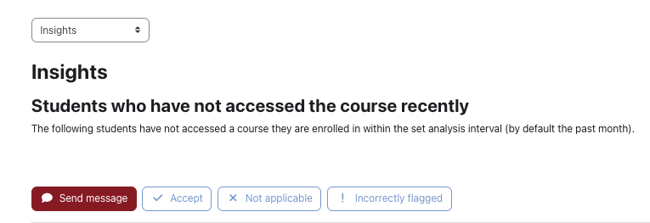
The link from either place noted above lists the students considered at risk.

In the Actions column, there are two links to further information that the model has regarding the student. The first (magnifying glass) is to a prediction, the second (the chart) to analysis of individual data points used.

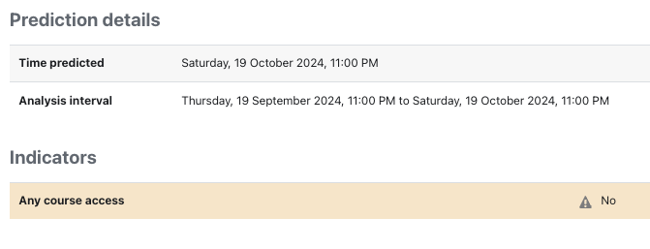
The prediction outlines the period over which the evaluation took place and when it estimated that the student would have engaged by. If it is now pas this time, the student is flagged as at risk.

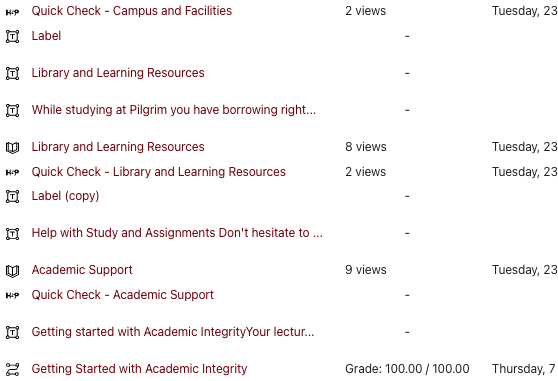
The analysis lists items from the unit that contribute to the prediction and shows the student’s engagement, or not, with each. Below we can see items that have been viewed multiple times, some that have not been viewed, a quiz results and the dates on which these took place.

At the top of the listing are four buttons.

The listing enables bulk actions by selecting the checkboxes in the left-hand column.
The Send message button enables you to immediately communicate with all of the students that have been selected.
The Accept button is to acknowledge the generation of the report for the selected student(s) and to remove the prediction from view.
There are some instances where a student is not expected to regularly engage with the unit. For example, orientation or college specific units are there to support students if needed and so may be sporadically engaged with. In these scenarios, click Not applicable to acknowledge the insight (as it is accurate), and remove the prediction about the student(s). This will provide feedback to the model for later instances of report generation.
If you have looked into a particular student’s activities and it appears that they have engaged the unit sufficiently, you can click Incorrectly flagged so that the model is updated for better predictive results.